Dashboard and metrics
The dashboard centralizes all your performance metrics and charts.
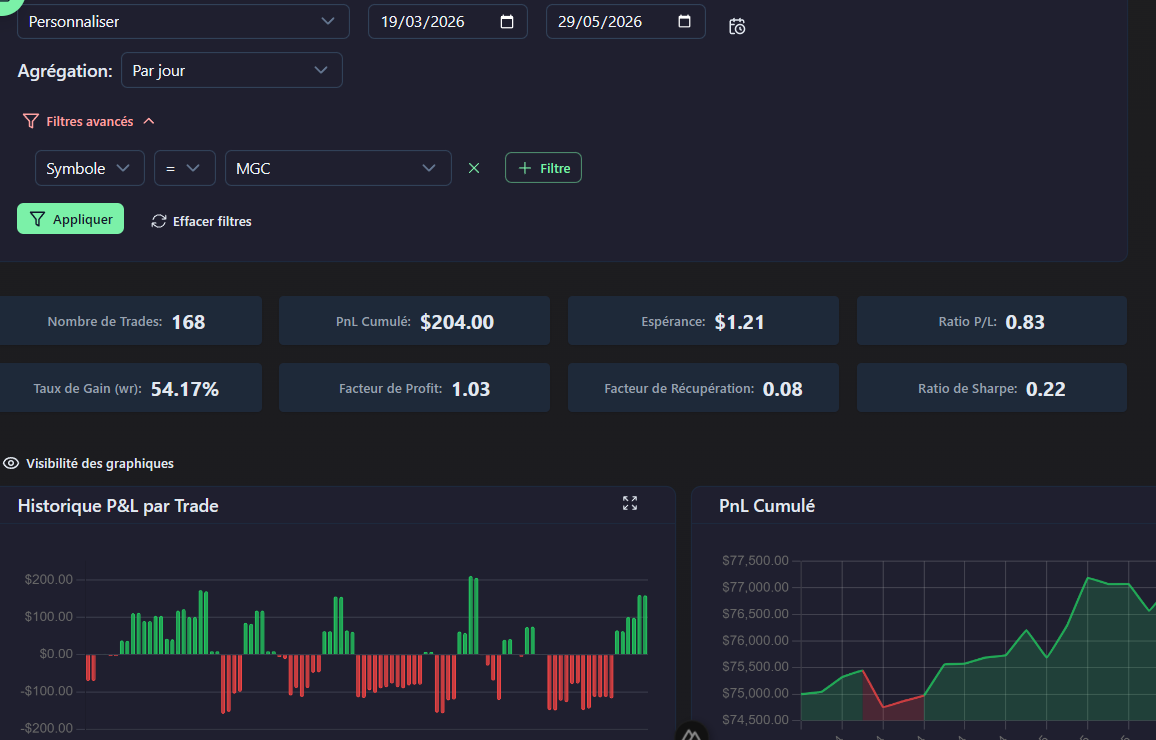
Key metrics
Displayed metrics include Cumulated P&L, Win Rate, Profit Factor, Sharpe Ratio (risk-adjusted return), Recovery Factor (recovery capability), and Expectancy (average expected gain per trade). Hover over each card to see its formula.
Available charts
4 charts are displayed by default. You can reorder them by drag-and-drop and hide those you don't need via the Visibility menu:
- Cumulated P&L: Capital evolution over time
- P&L History: Daily performance (green/red bars)
- Win Rate: Win rate evolution over time
- APPT: Expectancy (average gain per trade) over time
Net / Gross mode
Toggle between net P&L (after commissions) and gross (before commissions) via the toggle at the top of the page.
Dashboard filters
Refine your analysis with available filters:
- Period: Today, This week, This month, Custom
- Accounts: One or more trading accounts
- Aggregation: By day, week, or month
Advanced filters

In addition to basic filters, you can apply advanced filters. If you add multiple filter rows, they are combined with AND logic (all criteria must be met):
| Filter | Type | Description |
|---|---|---|
symbol | Text / List | Filter by one or more symbols |
type | Select | buy or sell |
openDate / closeDate | Date | Date range |
lot | Number | Position size |
profit | Number | P&L min/max |
tags | List | One or more tags |
Plugin slots
The dashboard exposes plugin slots for third-party extensions.
Detailed sections
At the bottom of the dashboard, 4 sections provide a quick overview:
- All trades: Global summary
- Winning trades: Statistics for profitable trades
- Losing trades: Statistics for losing trades
- Winners vs Losers: Side-by-side comparison